RAFFLES GRAIN / MARKET INTELLIGENCE
Understand the market.
Make informed
market decisions.
We put sellers’ grain to market. We also invest deeply in giving buyers a clear, unbiased view of market conditions—so they can assess supply, weigh their options and make informed purchasing decisions.
NDVI and rainfall dashboard snapshots supplied by Raffles Grain, alongside historical trade-flow examples. These images illustrate the analysis behind market conversations; they are not live feeds. Select any chart to view it at full size.
01 / VEGETATION CONDITIONS
NDVI.
A clearer view of crop development.
Compare vegetation patterns across Australian growing regions and seasons. The Normalized Difference Vegetation Index (NDVI) provides context on crop greenness and development as the season progresses.
For buyers
Build a more informed view of conditions across potential supply regions, alongside rainfall, crop reports and commercial availability.
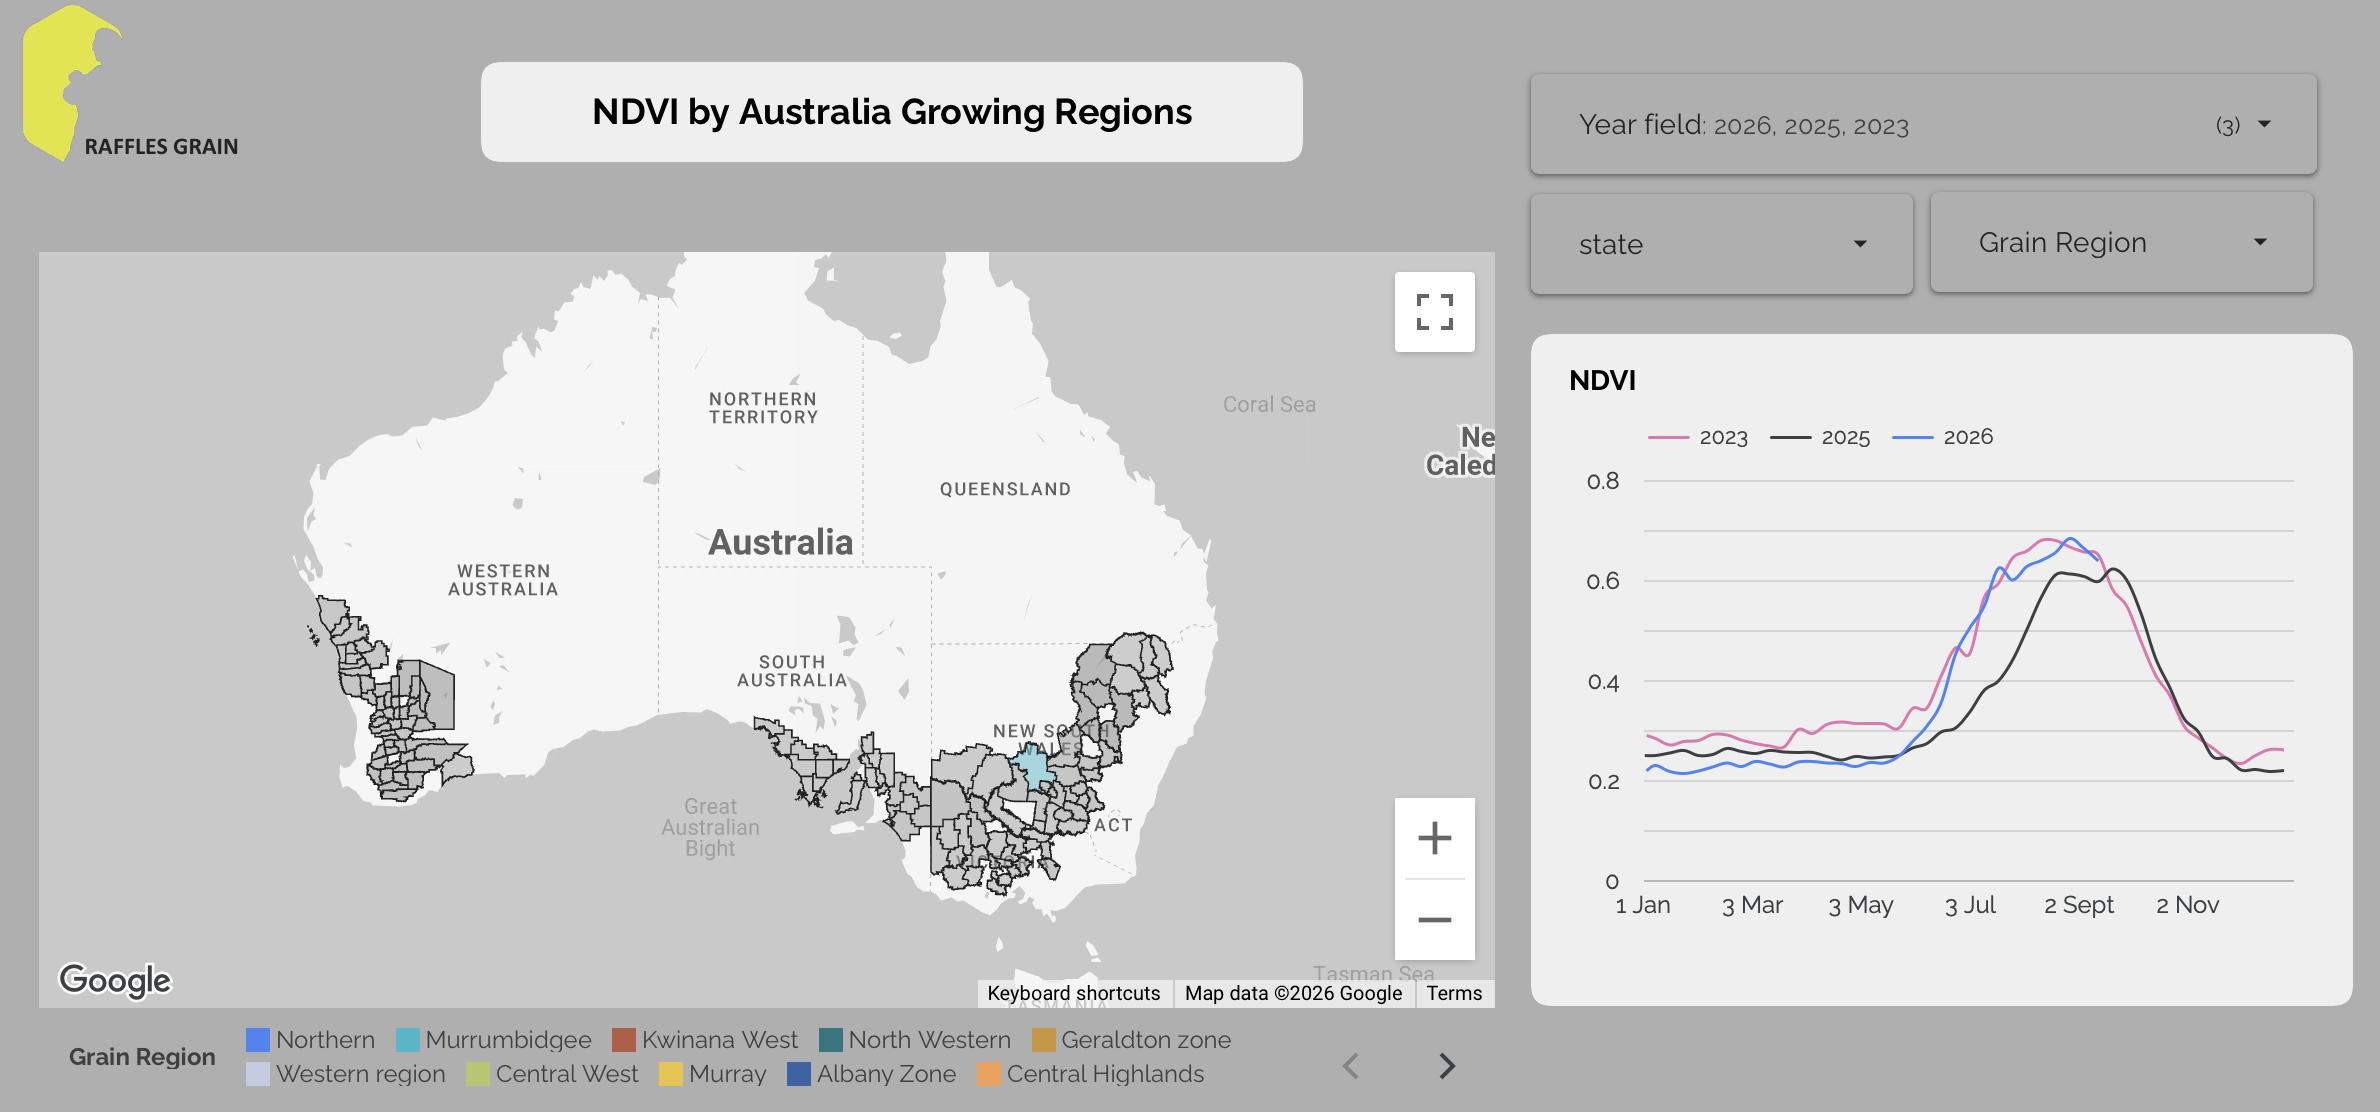
Supplied dashboard image · static snapshot · select to enlarge
02 / RAINFALL & SEASONAL CONDITIONS
Follow rainfall.
Understand the season.
Assess accumulated rainfall alongside the previous year and the stages of crop development. Regional patterns, rainfall timing and temperature events add context to the supply picture.
For buyers
Keep sourcing conversations grounded in the conditions affecting crop development, from biomass growth and flowering to grain fill.
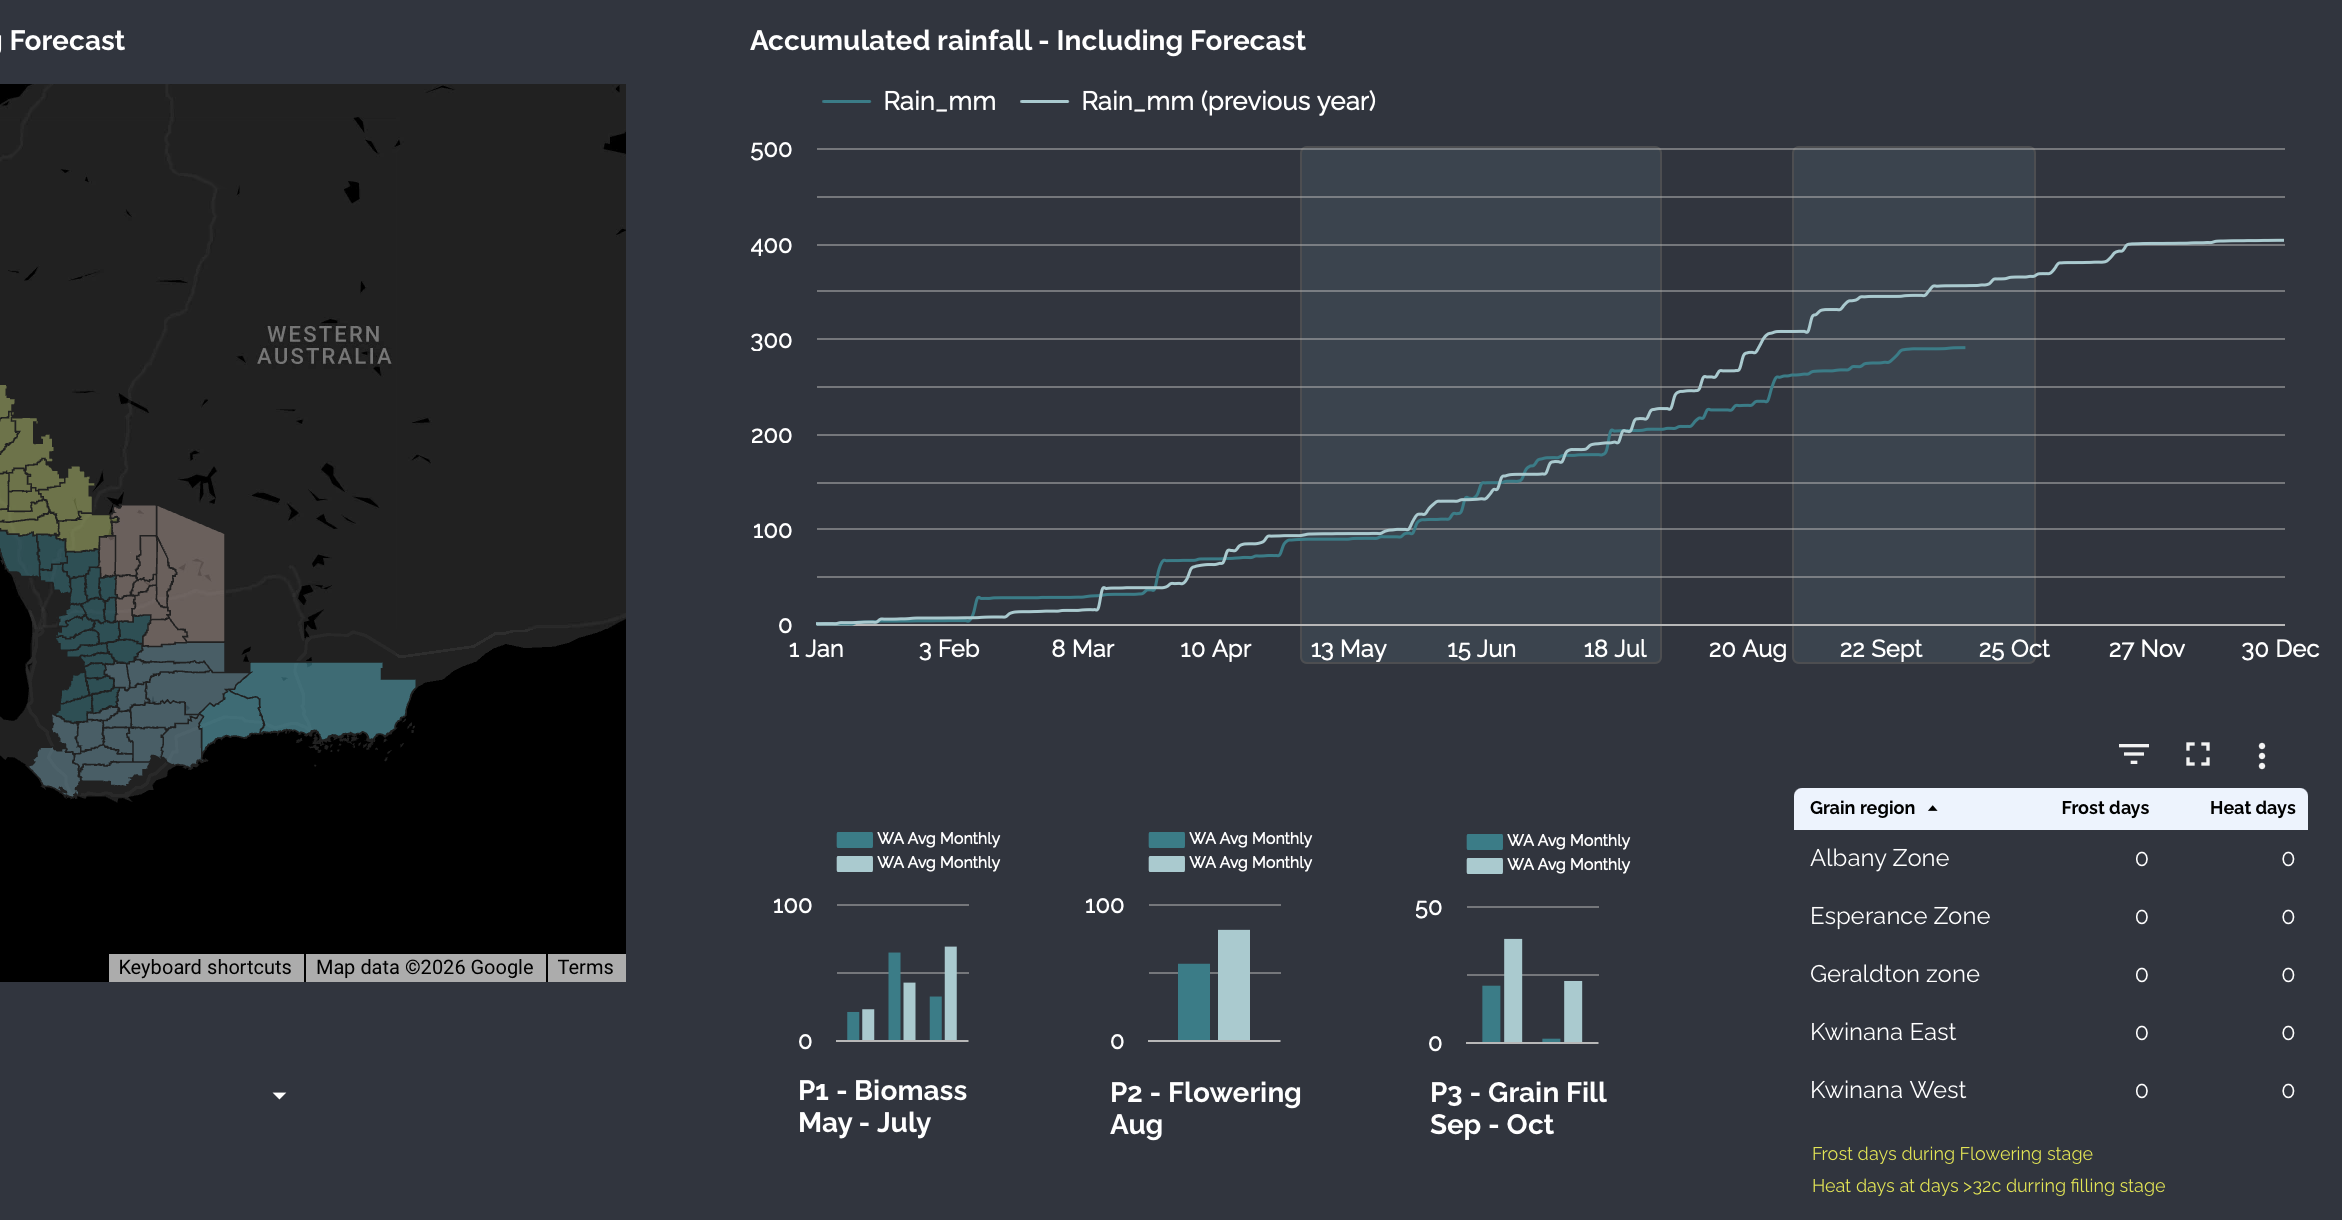
Supplied dashboard image · forecast shown as captured, not a live forecast · select to enlarge
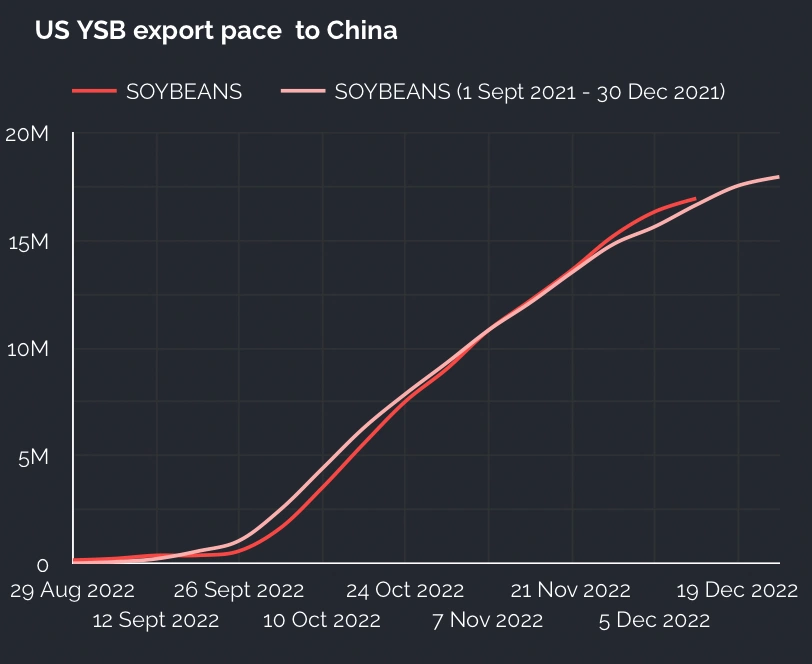
Source: ScoutAI product presentation, page 6. Original chart reproduced; not live export data. Select chart to enlarge.
03 / EXPORT DEMAND
Follow demand
beyond the headline.
Export pace helps buyers understand the wider demand picture. Comparing cumulative flows across seasons adds context to sourcing discussions and the timing of available supply.
For buyers
Assess competing demand across destinations as part of your sourcing and purchasing decisions.
04 / TRADE PATTERNS
Put seasonality
into perspective.
Trade flows rarely move evenly through the year. Seasonal comparisons help distinguish familiar patterns from developments that deserve a closer look.
For buyers
Compare shipment windows and seasonal demand when considering purchase timing and supply options.
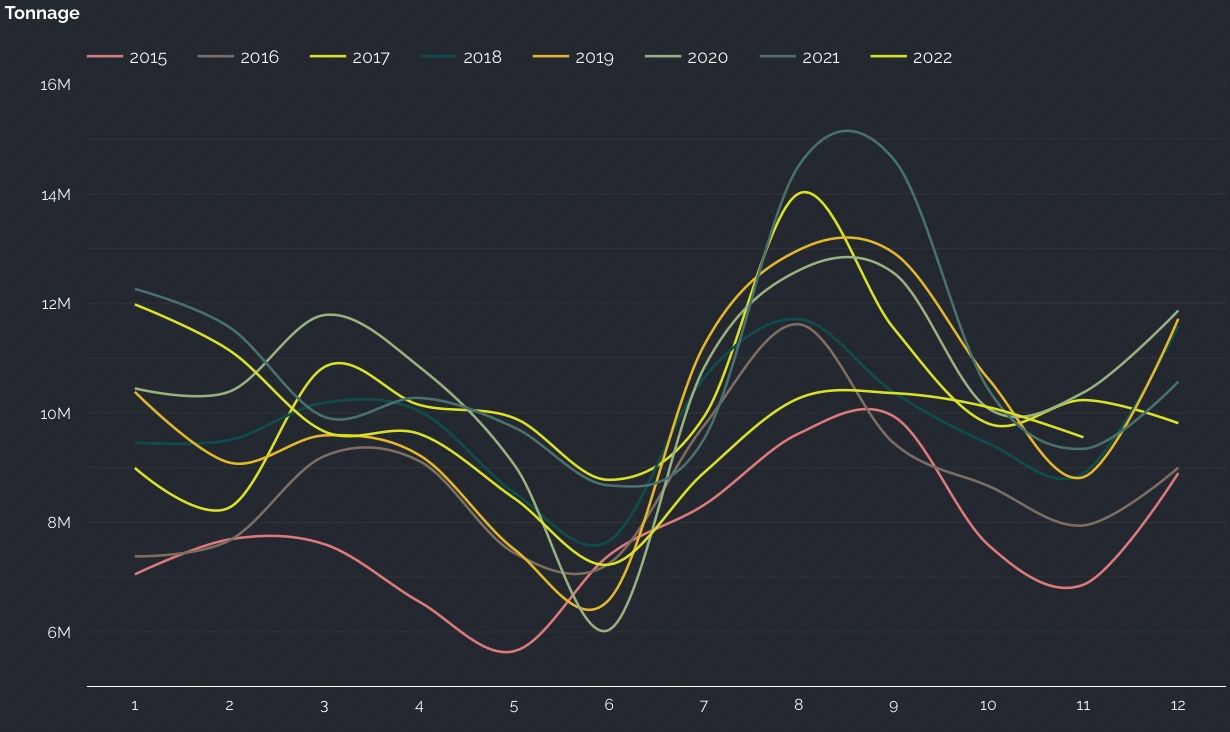
Source: ScoutAI product presentation, page 6. Original chart reproduced; not live trade data. Select chart to enlarge.
TURN PERSPECTIVE INTO A CONVERSATION
A clearer view.
A more informed purchase.
Tell us what you need to buy, your quality requirements and your delivery window. We bring an unbiased market perspective to the discussion.
Email Raffles Grain contact@rafflesgrain.com68 Circular Road #02-01049422 Singapore